Telemetry
Overview
The Telemetry module is responsible for collecting telemetry data from our services and exporting them to Loki and Prometheus. The Telemetry module consists of the following components:
Open Telemetry is a collection of tools, APIs, and SDKs used to instrument, generate, collect, and export telemetry data (metrics, logs, and traces) for analysis in order to understand your software's performance and behavior. In this project, we use Open Telemetry to collect logs, metrics and traces from our services. Then, we export them to Loki and Prometheus for further analysis.
Why do we need this?
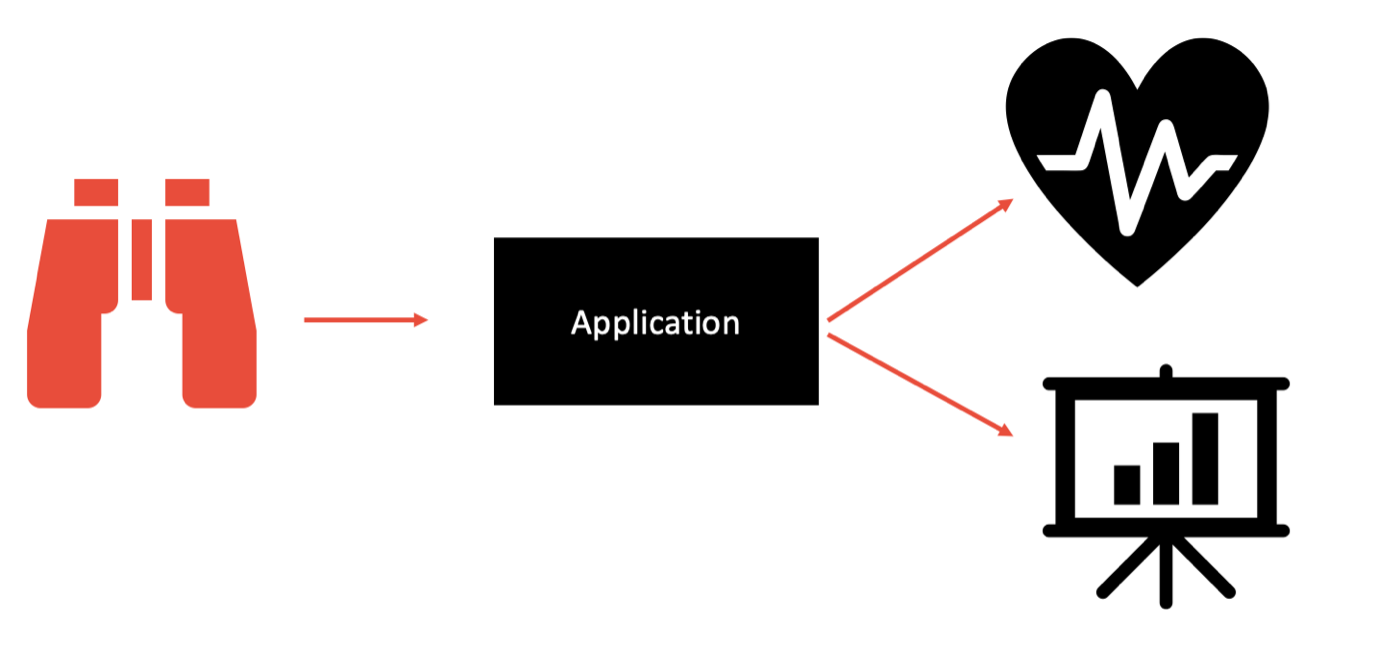
The Telemetry module is one of the most important modules in our project. It helps us to collect telemetry data from our services and export them to Loki and Prometheus. Then, we can use Loki and Prometheus to analyze the telemetry data and understand our software's performance and behavior. This is very important because it helps us to detect and fix problems in our software before they become serious.
Architecture
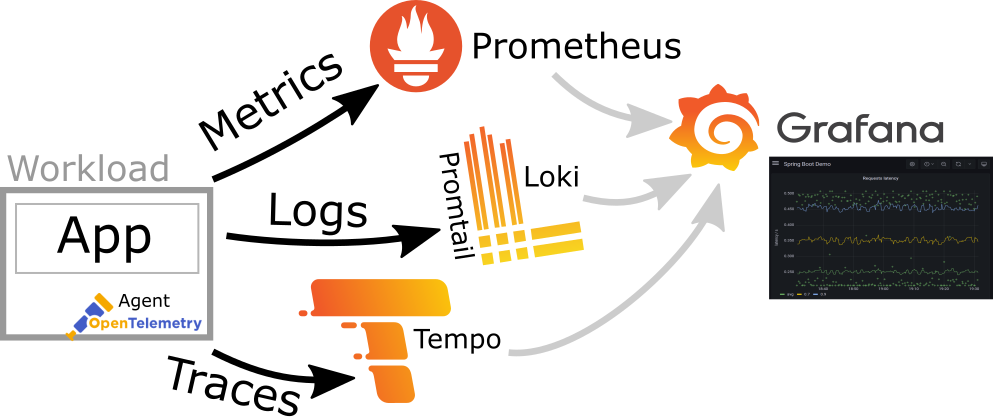
The above diagram shows the architecture of Open Telemetry. The Open Telemetry Collector is a vendor-agnostic agent that can receive telemetry data from multiple sources and export them to multiple destinations. In this project, we use the Open Telemetry Collector to collect telemetry data from our services and export them to Loki and Prometheus.
Configuration
The configuration of the Open Telemetry Collector is defined in the otel-collector.yaml file. The configuration file is divided into three sections: receivers, processors and exporters. The receivers section defines the sources of telemetry data. The processors section defines the processors that will be applied to the telemetry data. The exporters section defines the destinations of telemetry data.