Observability
Overview of Tools
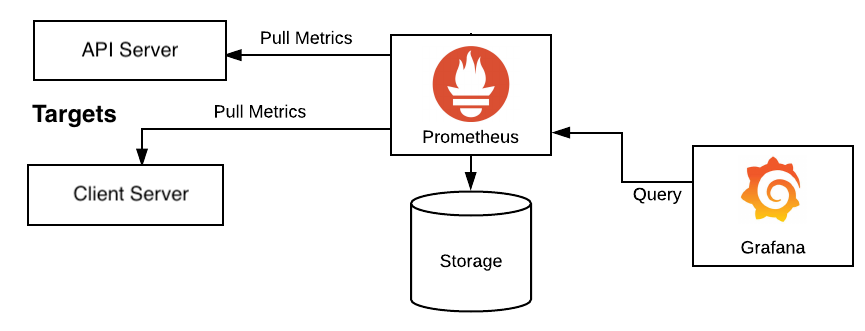
- Prometheus: In our project, Prometheus serves as a pull-based monitoring system that periodically scrapes and stores metrics from our services in its time-series database. It features PromQL, a query language for accessing these metrics, and a built-in alerting system for creating alerts based on metric conditions.
- Grafana: Grafana is a visualization tool that allows us to create dashboards and graphs for our metrics. It supports a variety of data sources, including Prometheus, and allows us to create alerts based on metric conditions.
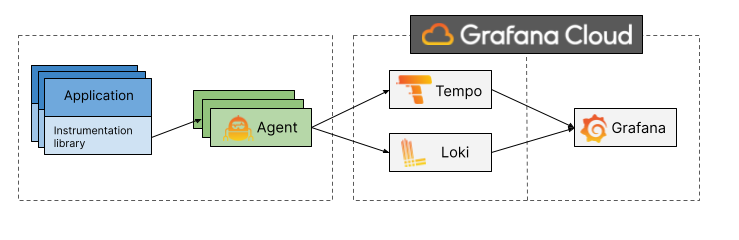
- Loki: Loki is a horizontally-scalable, highly-available, multi-tenant log aggregation system inspired by Prometheus. It is designed to be very cost effective and easy to operate. It does not index the contents of the logs, but rather a set of labels for each log stream.
- Tempo: Tempo is a high volume, distributed tracing backend. Tempo is designed to be horizontally scalable and cost-efficient. Tempo depends on Jaeger for its core functionality.
Installation and Configuration
We have setup all the tools above in the docker-compose.o11y.yml file. To start the monitoring system, navigate to the deploys/docker directory and run the following command:
docker-compose -f docker-compose.o11y.yml up -d
Best Practices
Logging
-
Log Levels: We should use the following log levels to indicate the severity of the log message:
DEBUG: Detailed information, typically of interest only when diagnosing problems.INFO: Confirmation that things are working as expected.WARN: An indication that something unexpected happened, or indicative of some problem in the near future (e.g.disk space low). The software is still working as expected.ERROR: Due to a more serious problem, the software has not been able to perform some function.FATAL: A serious error, indicating that the program itself may be unable to continue running.
-
Log Format: We should use a structured log format, such as JSON, to make it easier to parse and analyze logs. We can use a logging library to automatically format logs in a structured format.
-
Log Correlation: We should use a correlation ID to correlate logs across services. The correlation ID should be passed along to downstream services.
-
Log Sampling: We should sample logs to reduce the amount of logs that we need to store and analyze. We can use a sampling rate of 1% to 10% depending on the volume of logs.
-
Log Retention: We should set a retention period for our logs. We can use a retention period of 30 days to 90 days depending on the volume of logs.
-
Log Rotation: We should rotate our logs to prevent them from growing too large. We can use a log rotation period of 1 day to 7 days depending on the volume of logs.
-
Log Storage: We should store our logs in a centralized location. We can use a log storage solution such as Loki or ELK.
-
Log Analysis: We should analyze our logs to identify errors and performance issues. We can use a log analysis solution such as Grafana or Kibana.
Metrics
-
Metric Types: We should use the following metric types to measure the performance of our services:
Counter: A counter is a cumulative metric that represents a single numerical value that only ever goes up. A counter is typically used to count requests served, tasks completed, errors occurred, etc. Counters should not be used to expose current counts of items whose number can also go down, e.g. the number of currently running goroutines. Use gauges for this use case.Gauge: A gauge is a metric that represents a single numerical value that can arbitrarily go up and down.Histogram: A histogram samples observations (usually things like request durations or response sizes) and counts them in configurable buckets. It also provides a sum of all observed values.Summary: Similar to a histogram, a summary samples observations (usually things like request durations and response sizes). While it also provides a total count of observations and a sum of all observed values, it calculates configurable quantiles over a sliding time window.
-
Metric Names: We should use the following naming conventions for our metrics:
snake_case: Use snake case for metric names.service_name: Use the name of the service as the prefix for metric names.metric_name: Use the name of the metric as the suffix for metric names.metric_type: Use the metric type as the suffix for metric names.
-
Metric Labels: We should use the following labels for our metrics:
service_name: Use the name of the service as a label for metrics.metric_name: Use the name of the metric as a label for metrics.metric_type: Use the metric type as a label for metrics.status_code: Use the status code as a label for metrics.error_type: Use the error type as a label for metrics.error_code: Use the error code as a label for metrics.error_message: Use the error message as a label for metrics.error_stacktrace: Use the error stacktrace as a label for metrics.error_source: Use the error source as a label for metrics.error_target: Use the error target as a label for metrics.error_details: Use the error details as a label for metrics.error_cause: Use the error cause as a label for metrics.error_reason: Use the error reason as a label for metrics.error_action: Use the error action as a label for metrics.error_solution: Use the error solution as a label for metrics.error_recommendation: Use the error recommendation as a label for metrics.error_message: Use the error message as a label for metrics.error_stacktrace: Use the error stacktrace as a label for metrics.error_source: Use the error source as a label for metrics.error_target: Use the error target as a label for metrics.error_details: Use the error details as a label for metrics.error_cause: Use the error cause as a label for metrics.error_reason: Use the error reason as a label for metrics.error_action: Use the error action as a label for metrics.error_solution: Use the error solution as a label for metrics.error_recommendation: Use the error recommendation as a label for metrics.
-
Metric Sampling: We should sample metrics to reduce the amount of metrics that we need to store and analyze. We can use a sampling rate of 1% to 10% depending on the volume of metrics.
-
Metric Retention: We should set a retention period for our metrics. We can use a retention period of 30 days to 90 days depending on the volume of metrics.
-
Metric Storage: We should store our metrics in a centralized location. We can use a metric storage solution such as Prometheus or Graphite.
-
Metric Analysis: We should analyze our metrics to identify errors and performance issues. We can use a metric analysis solution such as Grafana or Graphite.
Tracing
-
Trace IDs: We should use a trace ID to correlate traces across services. The trace ID should be passed along to downstream services.
-
Trace Sampling: We should sample traces to reduce the amount of traces that we need to store and analyze. We can use a sampling rate of 1% to 10% depending on the volume of traces.
-
Trace Retention: We should set a retention period for our traces. We can use a retention period of 30 days to 90 days depending on the volume of traces.
-
Trace Storage: We should store our traces in a centralized location. We can use a trace storage solution such as Tempo or Jaeger.
-
Trace Analysis: We should analyze our traces to identify errors and performance issues. We can use a trace analysis solution such as Grafana or Jaeger.
Contributing
Contributions are welcome! For bug reports or requests please submit an issue or pull request on GitHub.
We follow the Contributor Covenant Code of Conduct.